Data Science Foundations

Home

Courses

Data & Analytics

Data Science Foundations

6 months duration
8 modules
Updated Jul 30, 2026
Data & Analytics
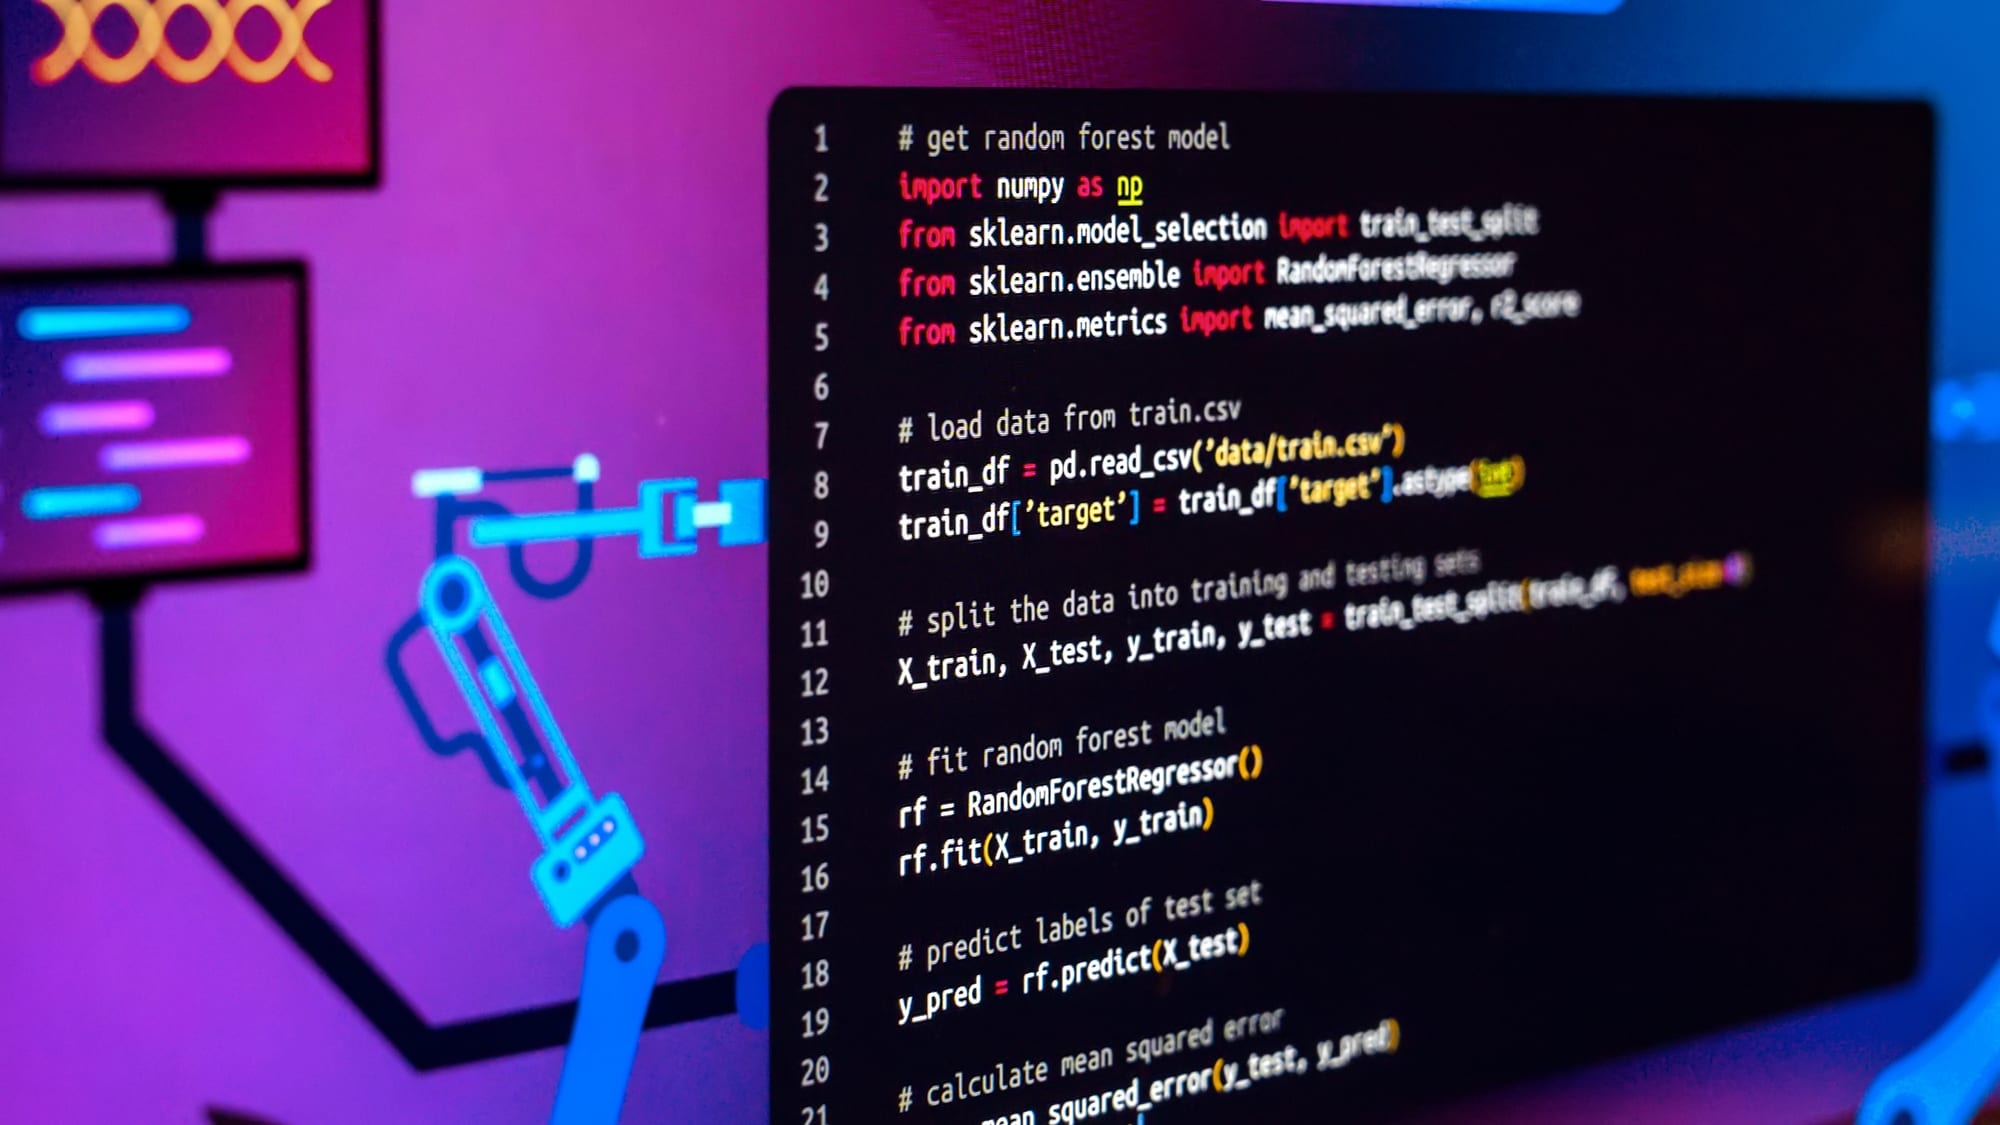
Data Science Foundations
Recently Updated

Course Overview

Get to know what this course is all about and what you'll learn

Course Description

Data Science Foundations is a seven-week introduction to working with data in Python. You'll learn to load, clean, explore, and model data — and finish by training and evaluating your first machine-learning model end to end.

What you'll learn

  • Write Python programs using core syntax, data structures, and functions
  • Manipulate and clean data with NumPy and pandas
  • Explore datasets and visualise them with Matplotlib
  • Apply foundational statistics used in machine learning
  • Split data and train a model with scikit-learn
  • Evaluate a model's performance and interpret the results
  • Complete an end-to-end project from raw dataset to a trained model

How it's delivered

Weekday lessons are on-demand (Monday–Thursday); live weekend sessions apply each week's topic with a mentor. The course ends with a capstone project. Submit every exercise and your capstone through your workspace.

What You'll Learn

Ship your first machine-learning model in seven weeks. Data Science Foundations takes you through Python, pandas, data visualisation, and core statistics — ending with a project where you build and evaluate a working model from a real dataset.

Course Curriculum

8 modules • Instructor-led • Hands-on projects

Course Curriculum

Prerequisites

Secondary-school maths and comfort with a computer. No prior coding required, though prior exposure helps you move faster. A laptop and an internet connection.

Learning Objectives

  • Write Python programs using core syntax, data structures, and functions
  • Manipulate and clean data with NumPy and pandas
  • Explore datasets and visualise them with Matplotlib
  • Apply foundational statistics used in machine learning
  • Split data and train a model with scikit-learn
  • Evaluate a model's performance and interpret the results
  • Complete an end-to-end project from raw dataset to a trained model

Course Modules

Master the fundamental tool that every professional developer uses daily. Learn to track changes, collaborate with others, and manage your code like a pro from the very beginning of your development journey.

What you'll learn

  • Understand version control concepts and why Git is essential for modern software development
  • Use GitHub effectively for remote repositories, collaboration, and showcasing your work to potential employers
  • Master Git basics including repositories, commits, branches, and merging for effective code management.
Python serves as the foundation of modern data science, providing essential programming skills for data manipulation, analysis, and machine learning. This module develops your Python proficiency from basics through data science applications.
You'll master Python fundamentals including data types, control structures, functions, and essential libraries. Hands-on exercises with real datasets teach you to write efficient code for data processing tasks and establish the foundation for advanced data science work.

What you'll learn

  • Write Python programs using core data types, variables, and operators
  • Control program flow with conditionals, loops, and comprehensions
  • Organise code into reusable functions and modules
  • Work with lists, dictionaries, sets, and tuples to structure data
  • Read from and write to files, handling common errors gracefully
  • Apply these fundamentals to simple data-manipulation tasks
NumPy is the foundation of scientific computing and machine learning in Python — every library you'll use later (pandas, scikit-learn, PyTorch, TensorFlow) is built on top of it. In this module, you'll move beyond Python lists into the world of N-dimensional arrays, where calculations on millions of numbers happen in milliseconds. You'll learn how to create, reshape, slice, and operate on arrays; how broadcasting lets you write expressive, vectorized code without loops; and how to apply NumPy's mathematical, statistical, and linear algebra tools to real datasets. By the end, you'll have the numerical fluency that every data scientist, ML engineer, and AI builder relies on daily.

What you'll learn

  • Explain NumPy's role in the scientific Python ecosystem and why vectorized operations outperform native Python loops.
  • Create and inspect N-dimensional arrays using array(), arange(), linspace(), zeros(), ones(), and random generators.
  • Apply indexing, slicing, fancy indexing, and boolean masking to access and modify array elements.
  • Reshape, transpose, stack, split, and concatenate arrays to prepare data for analysis and modeling.
  • Perform element-wise operations and apply broadcasting rules to compute across arrays of different shapes.
  • Use universal functions (ufuncs) and aggregation methods (sum, mean, std, argmax) along specified axes.
  • Solve practical problems using NumPy's linear algebra and random sampling modules, benchmarking vectorized code against pure Python.
  • Conduct statistical analysis on datasets using measures of central tendency (mean, median), dispersion (std, var, percentile), and correlation, applied along specified axes.
Data without visualization is just numbers on a screen — Matplotlib is how you turn those numbers into stories, insights, and decisions. As the foundational plotting library in Python, Matplotlib powers nearly every chart you'll see in data science notebooks, research papers, and production dashboards. In this module, you'll learn to build clear, publication-quality visualizations from the ground up: line charts, bar plots, histograms, scatter plots, and more. You'll master the anatomy of a figure, control every visual element with precision, and learn when to use which chart type to communicate effectively. By the end, you'll be able to take any dataset and produce visualizations that don't just display data — they reveal what matters.

What you'll learn

  • Explain the architecture of a Matplotlib figure (Figure, Axes, Artists) and the difference between the pyplot and object-oriented interfaces.
  • Create core chart types — line, bar, scatter, histogram, pie, and box plots — and choose the right chart for the data and message.
  • Customize plots with titles, axis labels, legends, ticks, gridlines, colors, markers, and annotations to produce clear, professional visuals.
  • Build multi-plot layouts using subplots(), GridSpec, and twin axes to compare datasets side by side or on shared scales.
  • Visualize statistical relationships and distributions, including error bars, confidence bands, and density plots, to support data-driven storytelling.
  • Style plots for different audiences using built-in styles, custom rcParams, and themes, and export figures in publication-ready formats (PNG, PDF, SVG).
  • Integrate Matplotlib with NumPy and pandas to visualize real-world datasets and communicate insights effectively in notebooks and reports.
If NumPy gives you the numerical engine, pandas gives you the cockpit. It's the tool data scientists, analysts, and ML engineers reach for first when working with real-world data — messy CSVs, database exports, API responses, time series, and spreadsheets. In this module, you'll master the two core data structures (Series and DataFrame) and learn how to load, clean, transform, merge, and analyze data at scale. You'll handle missing values, reshape datasets, group and aggregate like a SQL pro, and work with dates and time-indexed data. By the end, you'll be able to take a raw, unstructured dataset and turn it into clean, analysis-ready insights — the single most valuable skill in modern data work.

What you'll learn

  • Explain the pandas data model (Series, DataFrame, Index) and load data from CSV, Excel, JSON, SQL, and APIs into DataFrames.
  • Inspect, select, filter, and modify data using label-based (.loc), position-based (.iloc), and boolean indexing.
  • Clean real-world datasets by handling missing values, duplicates, type conversions, and inconsistent or malformed entries.
  • Transform data using apply, map, vectorized string operations, and conditional logic to engineer new features.
  • Group, aggregate, and pivot data using groupby(), pivot_table(), and crosstab() to summarize and analyze patterns.
  • Combine datasets through merging, joining, and concatenation, and reshape data with melt(), stack(), and unstack().
  • Work with time series data using DatetimeIndex, resampling, rolling windows, and date-based selection for trend and temporal analysis.
Statistics forms the analytical backbone of data science, providing methods to extract meaningful insights from data and validate findings. This module develops your statistical literacy from fundamental concepts through advanced techniques essential for machine learning and predictive modeling.
You'll master descriptive statistics to summarize datasets, probability theory to understand uncertainty, and inferential statistics to draw conclusions from sample data. Correlation and regression analysis reveal variable relationships and enable predictive modeling, while hypothesis testing provides systematic validation of assumptions and results.

What you'll learn

  • Calculate and interpret descriptive statistics including measures of central tendency and variability
  • Apply probability theory concepts and work with common probability distributions
  • Conduct hypothesis testing and interpret p-values, confidence intervals, and statistical significance
  • Perform correlation analysis and build linear regression models to identify variable relationships
  • Select and apply appropriate statistical tests based on data types and research questions
  • Evaluate model performance using statistical metrics and cross-validation techniques
  • Distinguish between statistical significance and practical significance in data analysis results
Train your first models. Split data, fit and tune models with scikit-learn, and evaluate performance so you can tell a genuinely useful model from a misleading one.

What you'll learn

  • Split data into training and test sets
  • Train a model with scikit-learn
  • Evaluate models with appropriate metrics
  • Interpret results and avoid common pitfalls
Capstone: end-to-end model from a real dataset — module in the Data Science Foundations course.

What you'll learn

  • Frame a prediction problem around a real dataset
  • Clean, explore, and engineer features for modelling
  • Train and compare several machine-learning models
  • Evaluate models with appropriate metrics and validation
  • Tune and select a final model, explaining the trade-offs
  • Communicate results and limitations to a non-technical audience
Send Feedback

0/3000

We review every submission 💙